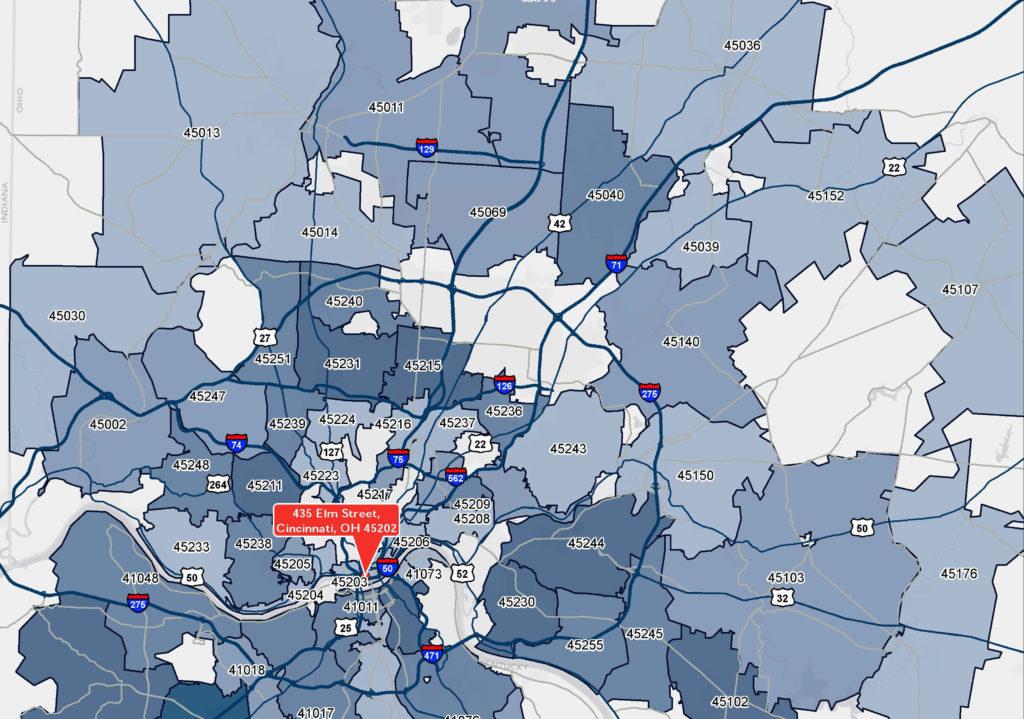
Analyzing locations based on a standardized Zip Code level is common. Typically this is called zip code analysis. We take customer location data in excel and display the densities of each zip by color and labeled each zip code, all overlaid on a custom base map.
Let’s say you have 75,000 addresses of customers. Seeing patterns in the individual locations will be difficult. What if you generalize it down to the zip code level? By generalizing your data you get to see the overall pattern of customers much easier than the original list. Things to watch out for is overselling density with larger zip codes. They could exaggerate the truth, an additional step in normalizing could be needed. Applying color to each zip code based on it’s value results in a heat mapping effect, drawing your eye to the most important areas.
The simplicity of this approach is what makes zip code analysis or heat mapping so valuable. It generalizes your data down to something that’s easy to understand.
Need to a zip code analysis or a heat map for your client? Contact us.
Read up on our other Real Estate map topics here. And find our more on our main page here.