Now that you have seen trade area basics of how they are created, how can you effectively use them? Remember that trade areas are a subjective thing that can be adjusted on the fly when new data is presented to the equation. So lets start adding more data to see if our trade area approach works.
Trade Area Basics
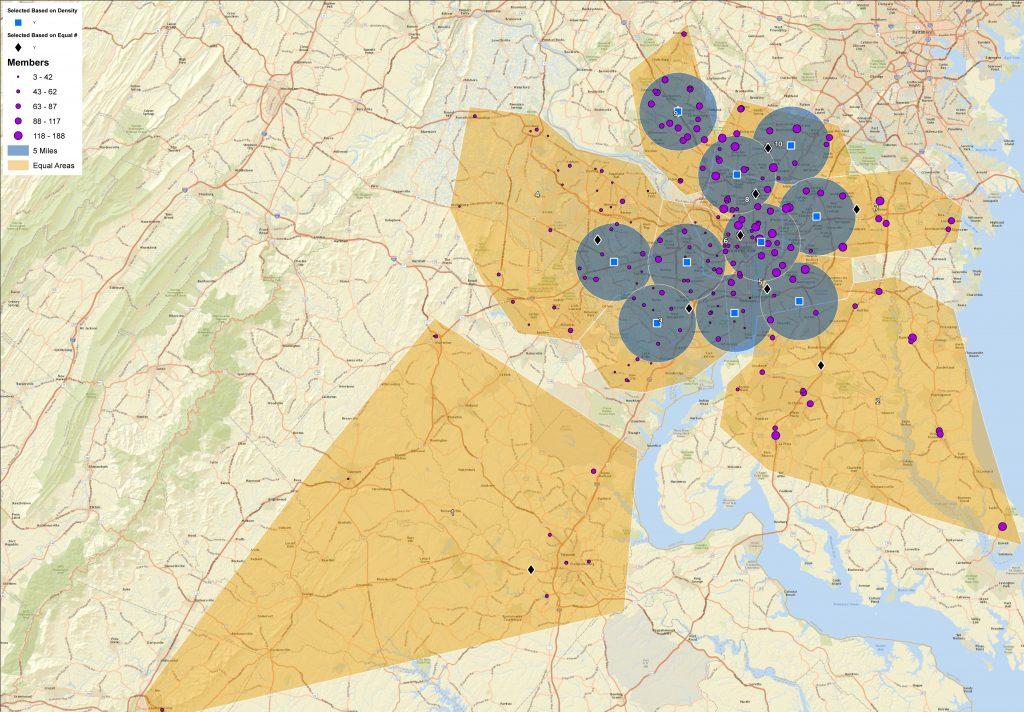
We had a client project that fit this sample set perfectly. We started from a location list of over 300 stores with the associated number of employees included in the data. Goals were create 10 equal trade areas (and the associated center location for each) based on a set distance & drive time. They also had to include roughly the same number of employees per trade area. Second goal was to show the 10 densest locations based on the number of employees per location.
After running the distance rings, then the drive times like shown in the previous Trade Area Basics articles, we added the extra dimension of number of employees. Finishing with the appropriate trade areas based on location and final numbers.
Second goal was approached a bit differently. Starting with a smaller distance of 5 miles we performed geographic searches trying to find the 10 locations that had the most employees without duplication.
Overall here is what we ended up with.

Great project to show off how to use Trade Areas in a practical way. Answering real world questions with the use of GIS.
Contact us for you next Trade Area map project.